Synthetic example walkthrough
Run the demo:
uv run python examples/quickstart.py
It generates these files:
What the fake workload is doing
The synthetic trace contains three request classes:
chat
rag
reasoning
The optimized scenario applies four changes:
prompt compression
more caching
tighter generation caps
reduced thinking-token budgets
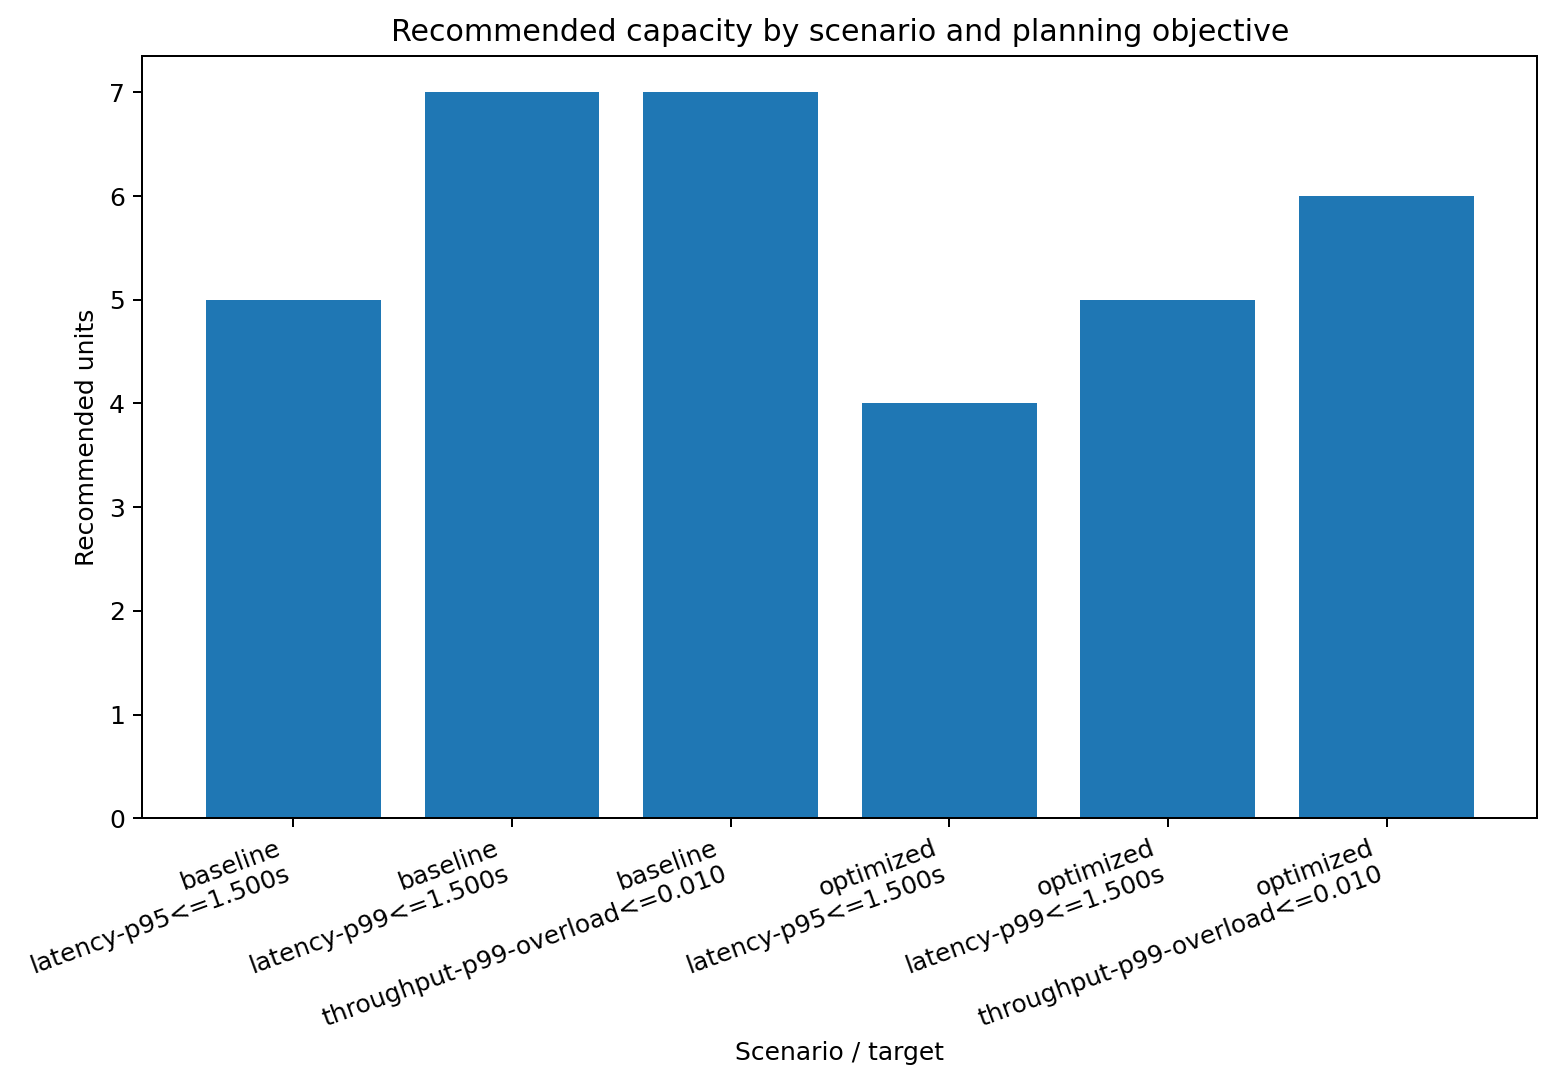
Current synthetic results
scenario |
objective |
target |
recommended units |
avg spare fraction (1s) |
overload probability (1s) |
achieved latency quantile |
|---|---|---|---|---|---|---|
baseline |
latency |
p95 <= 1.5s |
5 |
0.718 |
0.030 |
1.315s |
baseline |
latency |
p99 <= 1.5s |
7 |
0.794 |
0.006 |
1.428s |
baseline |
throughput |
p99 units, overload <= 1% |
7 |
0.794 |
0.006 |
- |
optimized |
latency |
p95 <= 1.5s |
4 |
0.713 |
0.032 |
1.157s |
optimized |
latency |
p99 <= 1.5s |
5 |
0.766 |
0.012 |
1.278s |
optimized |
throughput |
p99 units, overload <= 1% |
6 |
0.804 |
0.005 |
- |
Rendered plots
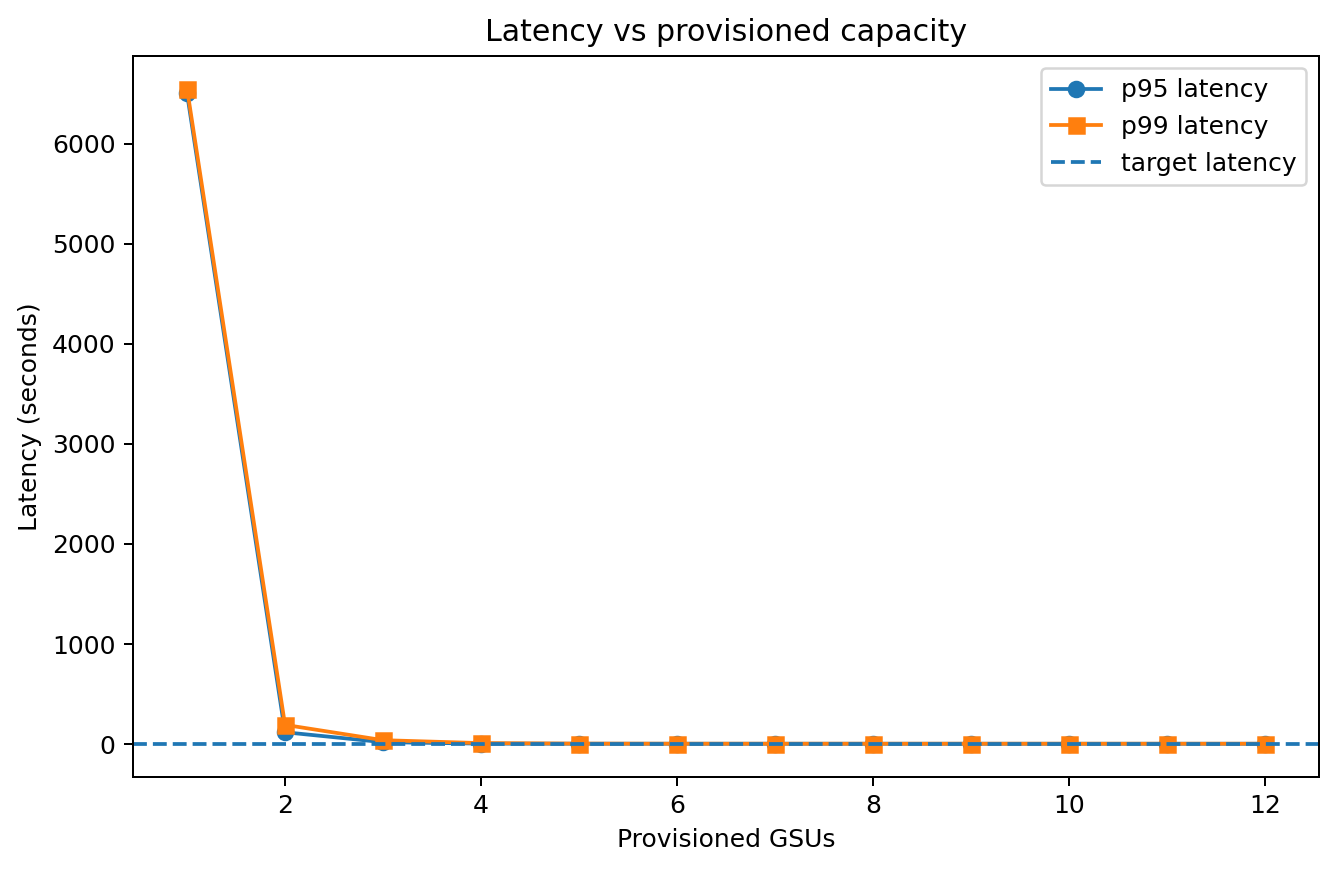
Latency vs capacity
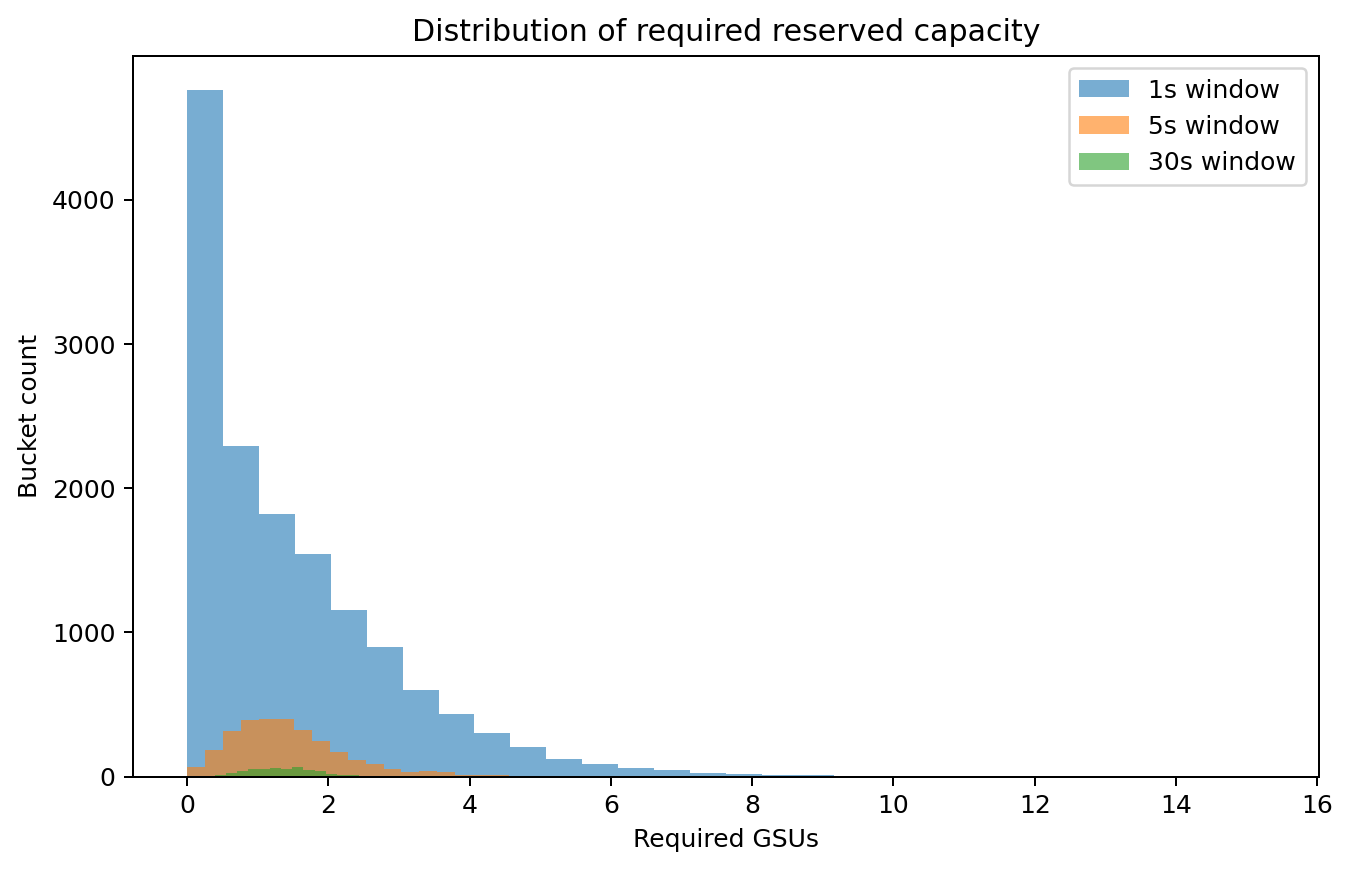
Distribution of required units
Optimization benefit
Percentile vs slack trade-off
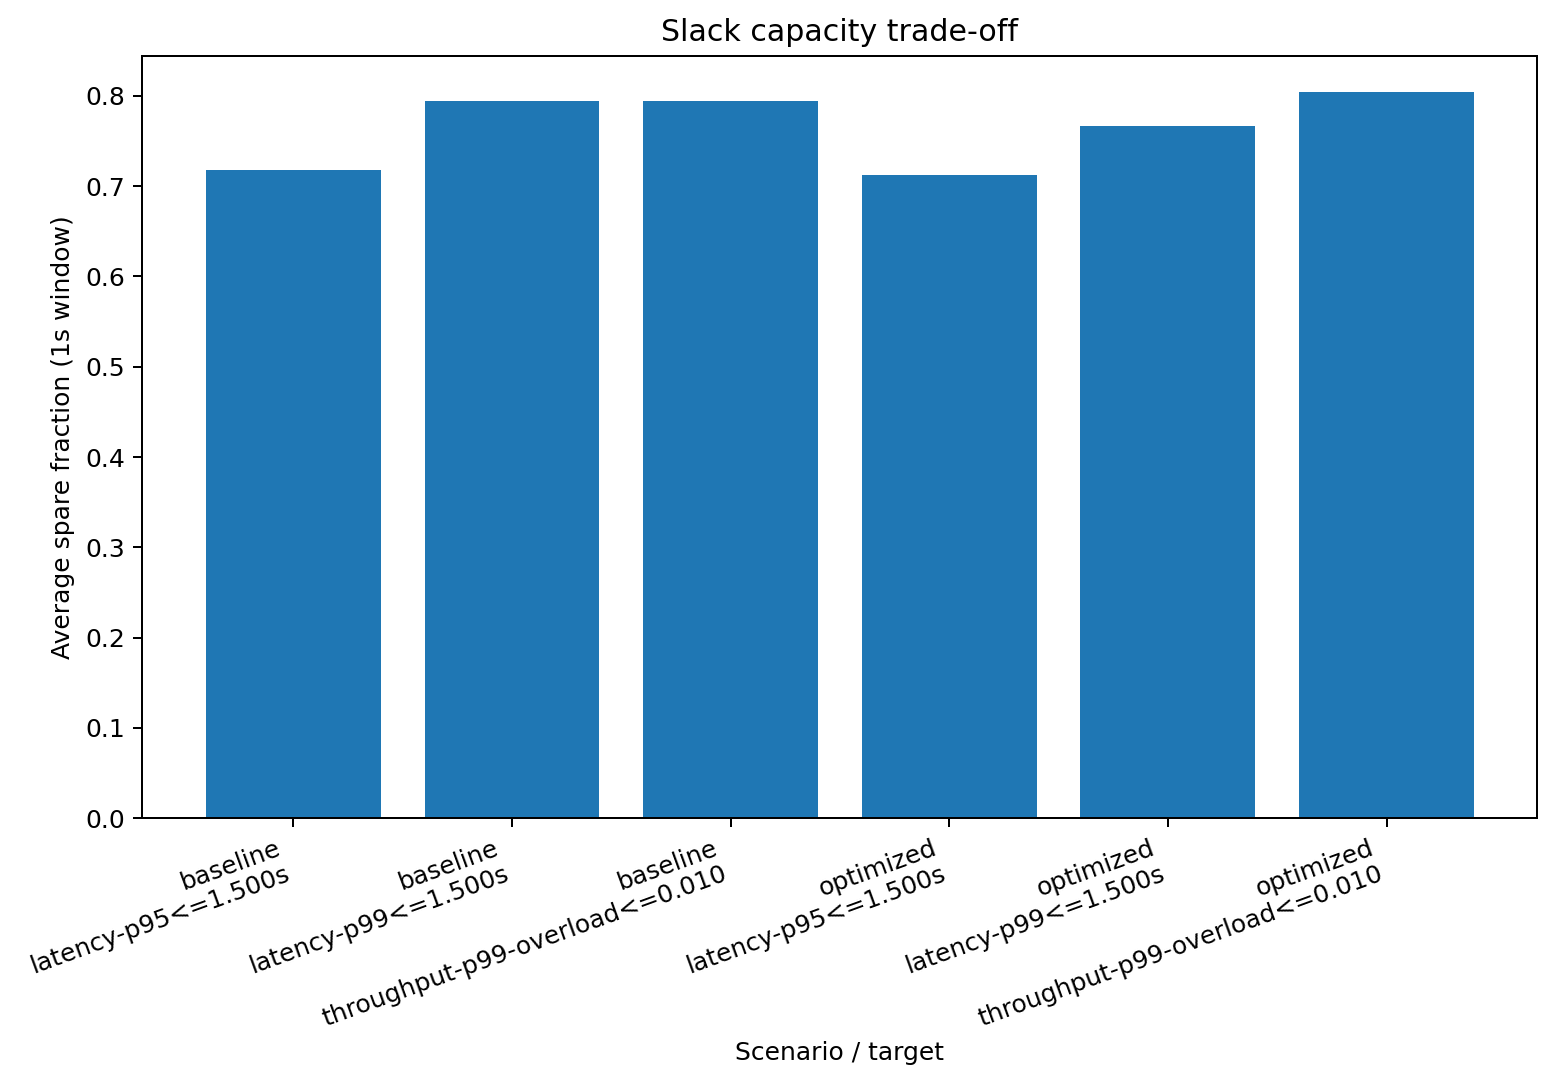
The important pattern is not the exact number. It is that stricter tail planning tends to buy more slack, while prompt/token optimizations can collapse the tail and shrink the reserved-capacity bill.